Synchronous Machine Armature Winding
The armature winding of a real three-phase machine is a distributed winding made up of many coils. In large hydrogenerators there may be as many a 500 coils arranged to produce in excess of 90 poles grouped into three phases. We will consider synchronous machines in terms of a simplified construction.
Induced Voltage & Frequency
As shown in the fundamentals of ac generation, the voltage induced in a winding due to a rotating field is given by
and the frequency of the induced voltage can be found from
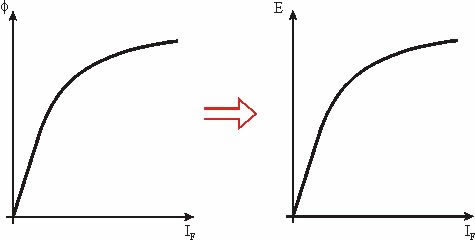
Remembering that iron saturates, if the speed of rotation is constant, the induced voltage will be a function of field current and the voltage-field current relationship will be proportional to the flux-filed current relationship.

Armature Current Flow
If armature current is zero induced voltage equals terminal voltage. If armature current flows, induced voltage is no longrer equal to the measured terminal voltage.
The reasons for the difference between induced voltage and terminal voltage are:
- Armature Reaction
- Armature Leakage Reactance
- Armature Resistance
Armature Reaction
Armature reaction is a reduction in the magnetic flux density due to armature current creating a magnetic field that opposes the rotor field.
Consider a rotating magnetic field and a multi-coil stator winding. As the magnetic field rotates, the voltage induced in each of the coils is in phase with the flux density. The magnetic and electrical phasor diagrams are similar.

Now, if the induced voltage is connected to a load and a lagging current flows, a magnetic field will be produced by the resulting armature current. This flux density phasor lags the current phasor by 90° electrically. Summing the rotor and armature flux densities, the resultant flux density will be different that produced the rotor flux density alone. As a result, the magnitude and phase of the induced voltage will be a function of the armature current. This effect is known as armature reaction and illustrated in the animation below
Click one of the buttons below to run the animation
The diagram on the left of the animation plots a simplified stator cross section, with 9 coils. The location of the peak of the fundametnal rotor mangnetic flux density is shown with a phasor arrow. The top right plot shows the sinusoidal variation of flux density around the airgap, and the bottom left plot shows the individual coil voltages that are induced. Pressing the "Voltage" button, the variation of flux density and voltages with time are is animated. Now, assume that we let current flow. The current in each coil is assumed to lag the voltage. The bottom right plot gives the individual coil voltages with time, while the diagram on the left now shows the current flow in each coil (red is out of the page, blue into the page). We can also plot the location of peak current as a phasor arrow. Now, the current flow will produce another magnetic field in the air gap. Clicking the "Field" button illustrates this effect.The stator field will lag the location of the stator peak currents by 90 degrees. This is shown as a dark red phasor, and plotted on the upper right. The combined net magnetic field, the stator field plus the rotor field, is shown in green, both as a phasor and on the upper right.
Mathematically, the net magnetic field is given by
and the net induced voltage can be written as
The term \(j\vec{I}_A X\) is used to account for armature reaction.
Finally, the terminal voltage will be reduced due to voltage drops across leakage reactance and winding resistance
Using the term \(X_S\) or synchronous reactance to include both armature reaction and leakage reactance, the final armature equation is obtained:
Armature Circuit
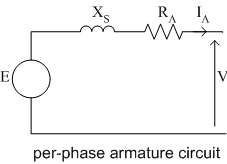
The circuit to describe one phase of a synchronous generator winding describes the armature equation given above.

A three-phase synchronous generator may be connected in either wye or delta configuration. However, it is common to find generators in wye configuration as the total line-line voltage is higher for a given phase voltage.
In wye connection
Note that the some texts use VT to denote terminal voltage. In examples and notes here we will use V to denote phase voltage and VLL for line-line terminal voltage
Synchronous Machine Phasor Diagrams
Information about the operation of synchronous machines is often determined by analysis of the armature circuit phasor diagram. Taking the armature circuit equation
the phasor diagram is constructed by taking the terminal voltage as the phase reference. Once the terminal voltage is drawn, additional phasors for current, resistive voltage drop, reactance voltage drop and induced voltage can be added. The shape of the phasor diagram is dependent on the phase of the current relative to the terminal voltage. Examples of leading, lagging and unity power factor are shown below.

The phasors are defined as:
- \(\vec{E}=E\angle \delta\). Where \(E\) is the open circuit induced voltage, also called excitation, and \(\delta\) is the load angle.
- \(\vec{V}=V\angle0\)
- \(\vec{I}_A=I_A\angle\theta\)
Summary
This page develops the idea of armature reaction in synchronous machines, and the equivalent circuit model for the armature circuit of a synchronous generator. The armature voltge equation is can be drawn graphically as a phasor diagram. Phasor Diagrams are used extensively in explaining the operation of synchronous generators.